
DEPARTMENT OF ECONOMICS WORKING PAPER SERIES
Do Driver Decisions in Traffic Court Motivate Police
Discrimination in Issuing Speeding Tickets?
Sarah Marx Quintanar
Louisiana State University
Working Paper 2011-13
http://bus.lsu.edu/McMillin/Working_Papers/pap11_13.pdf
Department of Economics
Louisiana State University
Baton Rouge, LA 70803-6306
http://www.bus.lsu.edu/economics/

Do Driver Decisions in Traffic Court Motivate Police Discrimination in Issuing Speeding
Tickets?
Sarah Marx Quintanar
12
November 2011
Abstract
This research provides new insights into police discrimination by following individuals’
decisions in the court process from the time a speeding ticket is issued to trial. Quintanar (2011)
finds that African-Americans and women are more likely to receive a speeding ticket from a
police officer as opposed to an automated source, but is unable to determine whether this is
evidence of statistical or preference-based discrimination. This paper expands upon those results
by using a unique dataset which contains detailed information about the court procedural choices
of individuals ticketed by police. African-Americans are more likely to fight their speeding
ticket, while there is no significant behavioral difference by gender. This contradicts a motive of
statistical discrimination by police; targeting individuals who are likely to pay immediately
rather than use court resources to fight the ticket. Potential discrimination in prosecutor and
judge behavior is also investigated.
1
Department of Economics, Louisiana State University, Baton Rouge, LA 70803.
Email: [email protected]su.edu
2
I would like to thank Kaj Gittings, Robert Newman, and Sudipta Sarangi for guidance in many matters related to
this research. Also thanks to Carter Hill for insight regarding econometric concerns and to Lafayette City Court for
their cooperation and willingness to help in the data collection process and related data questions.
Quintanar 2
I. Introduction
Discrimination on the basis of race, gender, age, and/or religion has been a focus of
extensive research since Becker (1957). Relatedly, researchers have also focused more
specifically on verifying that “Justice is Blind” is applied in practice in the U.S. court system
(Mustard, 2001; Schanzenbach, 2005; Anwar, Bayer, and Hjalmarsson, 2010). Court
discrimination has been investigated using judge and jury characteristics and sentencing
decisions, but the present work is the first to follow individuals through each stage of the court
process from receiving a speeding ticket, to pre-trial meetings with the prosecutor, and finally to
the trial itself. In addition to court discrimination, researchers have investigated police
discrimination in vehicle searches as well as ticket issuing, where some identify evidence of
statistical or preference-based discrimination (Antonovics and Knight 2009, Makowsky and
Stratmann 2009), but others find no such evidence (Grogger and Ridgeway 2006, Knowles et al.
2001, for example).
Quintanar (2011) used automated traffic enforcement as a measure of the population to
compare against police-issued speeding tickets. Controlling for location and violation
characteristics as well as a host of other determinants, police issued a higher proportion of
speeding tickets to women and African-Americans, as opposed to the proportion issued to those
groups by automated sources. Quintanar (2011) provides evidence of racial and gender
discrimination by police in issuing speeding tickets, but does not identify whether police are
engaging in statistical or preference-based discrimination. The present paper extends Quintanar
(2011) by analyzing individual behavior in the court system to provide evidence regarding the
type of discrimination police engage in when issuing speeding tickets.

Quintanar 3
While previous research has investigated police discrimination in traffic offenses, ranging
from vehicle stop and search to maintenance and speeding violations, these studies generally
employ police ticket data without considering individual responses to those tickets. For instance,
Makowsky and Stratmann (2009) investigate the impact of police preferences in issuing speeding
tickets and assigning speeding fines: specifically, whether their motives as agents of the
government influence who receives speeding tickets.
3
The authors find that police are more
likely to issue speeding tickets to individuals traveling at high speeds and those who have a high
opportunity cost of fighting the ticket, and therefore, those individuals who are less likely to
contest their speeding ticket. They identify opportunity cost in terms of distance from the
driver’s residence to the courthouse. Makowsky and Stratmann (2009) provide evidence that
police officers in Massachusetts are not race and gender blind: Hispanics and men in general
were more likely to be fined when stopped and the likelihood of a fine decreases with age.
These findings provide insight into relevant variables for this type of analysis.
In existing studies, with the exception of Quintanar (2011), data issues arise due to police
knowledge of data collection as well as nonreporting. If police know that a study on differential
treatment is being conducted, they may alter their behavior to avoid punishment. Similarly, data
are collected as a stipulation of a lawsuit in the majority of previous studies. Police may be
asked to record stops, searches, and/or tickets issued; however, if they only report a portion of
actual incidents, the measure of the population will be biased (Grogger and Ridgeway 2006 for
example).
4
These issues are not relevant in the current work, because the data were collected
without any prior knowledge of the study by the police department, and the dataset is comprised
3
Police officers in Massachusetts are able to decide who to issue speeding tickets to, as well as how much their fine
should be. This is different from the law in Louisiana, where the police officer has the discretion to issue tickets, but
a fine schedule determines the speeding ticket fine for drivers.
4
Also see Makowsky and Stratmann 2009, Knowles et al. 2001, Knowles and Todd 2007.

Quintanar 4
of the entire population of issued speeding tickets. Also, the research design in this paper is
unique because the dataset includes not only police issued tickets, but also each driver’s response
to those tickets throughout the court system.
This is the first paper to follow individuals through the court process, from speeding
ticket to trial, to investigate whether individual behavior supports the theory of statistical
discrimination by police. If women and African-Americans are more likely to pay their ticket
fine as opposed to asking for a trial, they may be targeted by police since the associated marginal
cost is lower for issuing tickets to these individuals. Individuals are able to make a series of
choices when determining how to proceed through the legally specified court process. By
following all individuals who receive a speeding ticket, it is possible to determine if behavior
differs by race or gender in regards to who is more likely to fight a speeding ticket in court.
Discrimination within the court system has been the focus of extensive research; at all
stages from initial police contact, to the jury determinance of guilt, to sentencing for those found
guilty of a crime (Mustard, 2001; Schanzenbach, 2005; Anwar, Bayer, and Hjalmarsson, 2010).
Though the United States criminal justice system is founded on the idea of justice being race and
gender blind, existing research is inconclusive as to whether that is true in practice. While
previous research investigates discrimination in court more broadly, this is the first to employ
such information as a motive for police discrimination, as well as the first to follow individual
decisions in dealing with a speeding ticket.
5
II. Modeling the Court Process
The court procedure for speeding tickets is explicitly defined by the law, but ticketed
individuals are in some ways able to decide how to navigate the process. Court protocol can be
5
Other researchers have followed individual or prosecutorial decisions through different stages of the court process
for assaults and other crimes (eg. Wooldredge et al. 2004, Kingsnorth et al. 1998, and Leiber and Mack 2003).
Quintanar 5
defined as four decision stages: some of which are reliant on the individual, while others depend
on prosecutor discretion (the representative of the court). The best way to understand this
process is to first examine each stage individually.
Stage 1: Driver Decision to Attend Initial Hearing
A driver’s first decision is whether to pay the fine associated with their speeding violation
or to attend an initial hearing (called an arraignment). Each individual has the option to pay their
ticket fine without attending a hearing either by mail or at payment windows located at the
Lafayette City Courthouse. Though it is relatively easier to pay a ticket fine by mail than to
attend a hearing, individuals may choose to attend an arraignment to try and get a reduced charge
(a deal) from the prosecutor. A ticketed driver will choose to attend an arraignment if they
believe there is a positive net benefit of doing so. For each individual, , this unobservable net
benefit of contesting can be defined as the difference between the expected value of the benefit
of attending a hearing minus the expected cost of paying the ticket:
. (1)
and the equation for expected benefit of attending a hearing can be defined as:
, (2)
where the subscript ( =1, 2, 3, 4) is implemented to denote a decision stage, since
expected action in future stages is now relevant and
is the probability of not receiving a
deal from the prosecutor in the next stage. The error term,
, is assumed to be distributed
standard normal.
Individual drivers can determine the amount of their fine,
, by calling
Lafayette City Court. Though the schedule of fines is not published, fine amounts are based on

Quintanar 6
the severity of the violation, other violation characteristics, and the driving history of the ticketed
individual (the number of previous moving violations or other infractions). All of this
information is available in the data and will be discussed in greater detail in Section III.
6
The net benefit of contesting also depends on the probability of not receiving a deal from
the prosecutor in the next stage and the driver’s opportunity cost of fighting the ticket. If
individuals believe that they have a very low chance of receiving a deal, they will be less likely
to choose to fight their ticket. This probability depends on variables which the individual driver
assumes are relevant to the prosecutor’s decision: severity of the violation, the driver’s driving
record, and perhaps even personal characteristics. Relatedly, individuals who have a higher
opportunity cost, i.e. those who earn higher wages, are going to face a lower expected net benefit
of contesting a ticket.
The reduced form of equation (1) is:
(3)
where the vector
includes individual specific and violation related variables which
influence the net benefit of contesting, and
is an error term, which will be explained in detail
later.
Recall that the true net benefit of contesting (
) is unobservable, and we only observe
each individual’s decision (
) once they have considered this expected benefit. In the first
6
It is important to note that what is observed in the data is the fine amount paid by the driver. Therefore, if an
individual chooses to attend an arraignment, it is impossible to determine what the fine would have been if they had
instead chosen to pay the fine initially by mail. Though this is a limitation of the data, lack of knowledge of the fine
at alternative stages of the court process does not affect the investigation of the existence of discrimination, since we
are merely interested in individual choices at each stage, and we are aware when an individual receives a deal from
the prosecutor.

Quintanar 7
stage, individuals either choose to attend an arraignment (
) or they choose to pay by mail
or at a ticket window (
), where
is each individual’s decision in Stage 1.
Stage 2: Prosecutor Decision Not to Grant a Deal at Initial Hearing
The second stage of the court process is the prosecutor’s decision to grant a deal or not to
grant a deal. In this context, a deal is either a reduction in the cited severity of the ticket (eg.
travelling between 16 and 20 miles over the limit instead of more than 21 miles over the limit) or
the speeding ticket is amended to a non-moving violation (not wearing a seatbelt for example).
7
Notice that this decision is only relevant if the ticketed individual chose to contest the ticket and
attend a hearing (if
). Those drivers who paid by mail or at a ticket window are no longer
observed in the data.
Prosecutors grant the majority of deals for two main reasons: to give “good” drivers a
break or to convince someone with other, more serious offenses to pay their fine without
attending a trial. Prosecutors are less likely to be concerned with enforcing a strong punishment
on “good” drivers because they received a ticket for minor speeding violations and have zero or
few prior violations. At the other extreme, severe violators with multiple tickets may be more
willing to pay all of their fines if they receive some sort of deal for one violation. For example, a
driver who received a ticket for speeding and a ticket for driving without insurance at the same
traffic stop has the right to go to trial for both tickets. The prosecutor may make a deal with the
driver: agree to pay both tickets in exchange for a lesser penalty associated with the speeding
7
Prosecutors also have complete discretion to grant a more extreme type of deal: a dropped charge. These drivers
are likely different from the remaining sample in unobservable ways since prosecutors are more likely to give these
types of deals to individuals to whom they are personally connected, as well as a few “fluke” cases where there is a
ticket error. These individuals are dropped from the sample for these reasons.

Quintanar 8
ticket. In this way, the prosecutor can avoid the costs associated with a trial, while still obtaining
ticket revenue for the city.
8
The probability that an individual will continue to fight their ticket in the next stage also
may influence the prosecutor’s decision. The prosecutor’s goal as a member of the court is to
punish the guilty without punishing the innocent at the lowest possible cost to society
(Reinganum 1988). Therefore, on the margin the prosecutor will prefer to grant a deal to those
drivers he considers likely to attend trial, in order to reduce the costs to the court.
9
These
prosecutorial decisions are entirely discretionary, and there are no rules or regulations regarding
how deals should be granted.
10
For these reasons, it is assumed that the general prosecutor’s
decision is based on violation as well as individual-specific characteristics about the driver (
),
as well as the probability that the individual will continue to contest their ticket in the following
stage (
):
(4)
Notice that the probability that the individual will contest their ticket again in the
following stage is driven by the same violation and driver specific variables mentioned
previously for Stage 1: the potential net benefit of contesting in terms of a reduced fine. Similar
to the equation describing the structural model of driver’s decision, equation (4) above defines
the structural model of prosecutorial decision in Stages 2 and 4. This formulation leads to the
following characterization of the prosecutor’s decision for Stage 2:
(5)
8
The information in the preceding paragraph was obtained through personal communication with individuals
directly involved in traffic court and employed by Lafayette City Court.
9
This probability will play a larger role for less severe offenders, because more severe offenders will require a
higher punishment, and thus the prosecutor may not care if those offenders continue to trial. However, the severity
of the crime is controlled for explicitly.
10
This information was obtained through personal communication with individuals directly involved in traffic court
and employed by Lafayette City Court.
Quintanar 9
is only observed if
.
where
means that the individual did not receive a deal from the prosecutor
(
means the individual did receive a deal). Again,
is a vector of the relevant
personal and violation attributes of the ticketed individual. The data explicitly specify when an
individual receives a deal from the prosecutor as opposed to when the driver continues on within
the court process without a deal. Similarly, if a driver pays their ticket, the data will specify
whether they did so after receiving a deal from the prosecutor.
Stage 3: Driver Decision to Request a Trial
The remaining two stages of the court process follow exactly from Stages 1 and 2. After
Stage 2, those individuals who did not receive a deal have another decision to make: ask for a
trial or “give up” and pay their fine. This decision defines Stage 3. Again, ticketed drivers
weigh the cost of the ticket with the expected benefit of attending another hearing. This decision
is modeled in the same manner as equation (3):
(6)
is only observed if
where
if the individual decides to go to court for a trial, and
if the
individual pays their fine without attending an additional hearing.
Though this decision is very similar to the decision made at Stage 1, one main difference
is the structure of an arraignment versus a trial. Trials are much longer processes than
arraignments: numerous cases are heard at arraignments where general details are discussed.
However, trials focus on the details of one case, and much more time is spent investigating those
Quintanar 10
details. Relatedly, individuals who choose to attend trial must have some experience with the
court system, judge, and prosecutor, since they all attended an arraignment in Stage 1.
Stage 4: Prosecutor Decision to Grant a Deal at Trial
Lastly, individuals reach Stage 4 if they chose to attend a hearing initially, did not receive
a deal from the prosecutor, and then decided to continue fighting their ticket. Analogous to
Stage 2, the prosecutor has the opportunity to grant deals to some of these individuals. Stage 4,
the final prosecutor decision, is modeled following equation (5), where
if the
individual did not receive a deal from the prosecutor and
if they did receive a lesser
sentence:
(7)
and
are only observed if
.
Now that the theoretical model is established, a closer look at
is in order. If the four
stages are independent, the model may be estimated by using four independent probit equations
(Greene 2008). However, if the error terms between stages are related through unobservable
variables, the model needs to account for any selection bias driving some individuals and not
others deeper into the court process. If such a correlation across error terms exists, coefficients
estimated by independent probit models will be biased.
III. Data and Descriptive Statistics
1. Data
This paper follows individuals through the court process who received a speeding ticket
in Lafayette, Louisiana between August 2007 and February 2008. Lafayette is a city in southern

Quintanar 11
Louisiana with a population of 133,985, about 60 miles west of Baton Rouge. About 65% of
Lafayette residents are white and about 30% African-American.
11
The data were collected from Lafayette City Court’s computerized log of misdemeanor
charges, and include information about the speeding violation itself, as well as choices made by
both the driver and prosecutor throughout the court process. The explanatory variables (some
driver characteristics are primary variables of interest) used throughout this analysis can be
grouped into four categories: driver characteristics, violation specifics, court-related variables,
and socioeconomic characteristics. Driver characteristics include: race, gender, age, age squared,
and the number of moving violations in the past year.
Quintanar (2011) found that African-Americans and women receive proportionately more
speeding tickets from police officers than they do from automated sources. This paper uses
identical ticket data, appended with driver and prosecutor choices through the court process to
test whether those findings are the result of statistical discrimination or tastes for
discrimination.
12
Race and gender are the main variables of interest: a negative, significant
coefficient on these variables in Stages 1 or 3 would provide supportive evidence for statistical-
discrimination by police in issuing speeding tickets. A negative coefficient implies that African-
Americans (women) are less likely to fight their speeding ticket, and instead, are more likely to
pay their fine upfront, by mail or at a ticket window. Therefore, police ticket individuals who are
more likely to pay their fines instead of attending court, saving the court time and money.
If the marginal effect of being female or African-American is positive, the data are in
opposition to the statistical discrimination story, and instead provide support for preference-
based discrimination. A positive coefficient implies that women and/or African-Americans are
11
Census 2000 and American Community Survey 2005-2009. (http://factfinder.census.gov)
12
Quintanar (2011) only analyzed tickets issued between October 2007 and February, whereas the sample in this
paper also includes tickets issued in August and September 2007.
Quintanar 12
more likely to fight their speeding tickets by attending an arraignment or trial, and thus police are
targeting individuals who are likely to consume more judicial and court resources. Therefore,
police are likely targeting these groups for some other reason, which may be a preference for
ticketing these individuals.
Age is included because previous studies have found an impact of age on police and
judge behavior (Makowsky and Stratmann, 2009). The remaining driver characteristic is more
specific to the court system: the number of prior moving violations that the driver has on his/her
record. Prosecutors will likely be harsher on individuals with a history of committing traffic
violations than those who have a clean record. If individuals are aware of these prosecutorial
behaviors, they will consider those behaviors when making decisions.
Severity of the speeding violation is coded in ranges of 5 miles per hour over the limit: 5
to 10 miles over the limit, 11 to 15 miles over the limit, 16 to 20 miles over the limit, and the
omitted category of more than 21 miles over the limit. This is an important control, since a more
severe speeding violation carries a higher fine, and thus a greater potential benefit for ticketed
drivers if they are successful in requesting a deal. Despite the higher potential benefit, it is likely
that prosecutors are harsher on drivers with more severe violations, since these violators are
more dangerous. It is also known whether the ticket was issued in a school zone.
Some drivers receive a speeding ticket as well as another ticket during the traffic stop; for
example, they may receive a ticket for no insurance in addition to a ticket for speeding 10 miles
over the limit. These additional tickets may indicate to the prosecutor that this driver is more
dangerous, conditional upon the severity of that additional ticket, thus increasing the likelihood
of not receiving a deal.

Quintanar 13
There is one court-related variable relevant to driver and prosecutorial decisions
throughout the court process: an indicator for which judge is assigned to the case. Each driver is
assigned to one of two traffic court judges when they are issued a ticket, though they are not
aware of which judge they have been assigned until attending an arraignment. If the two judges
behave differently, judge assignment may impact decisions made by both the ticketed driver and
the prosecutor.
13
Lastly, socioeconomic variables linked to the driver’s home zip code include: log per
capita income, percent of individuals whose education level is a high school degree up to some
college, percent of individuals whose education level is a college degree or higher, miles from
the Lafayette City Courthouse to the home zip code, and more specific controls for the length of
time it takes to drive to the courthouse.
14
These controls provide information about the
individual’s socioeconomic status as well as proxy for the opportunity cost of contesting a
speeding ticket.
15
2. Court Process and Descriptive Statistics
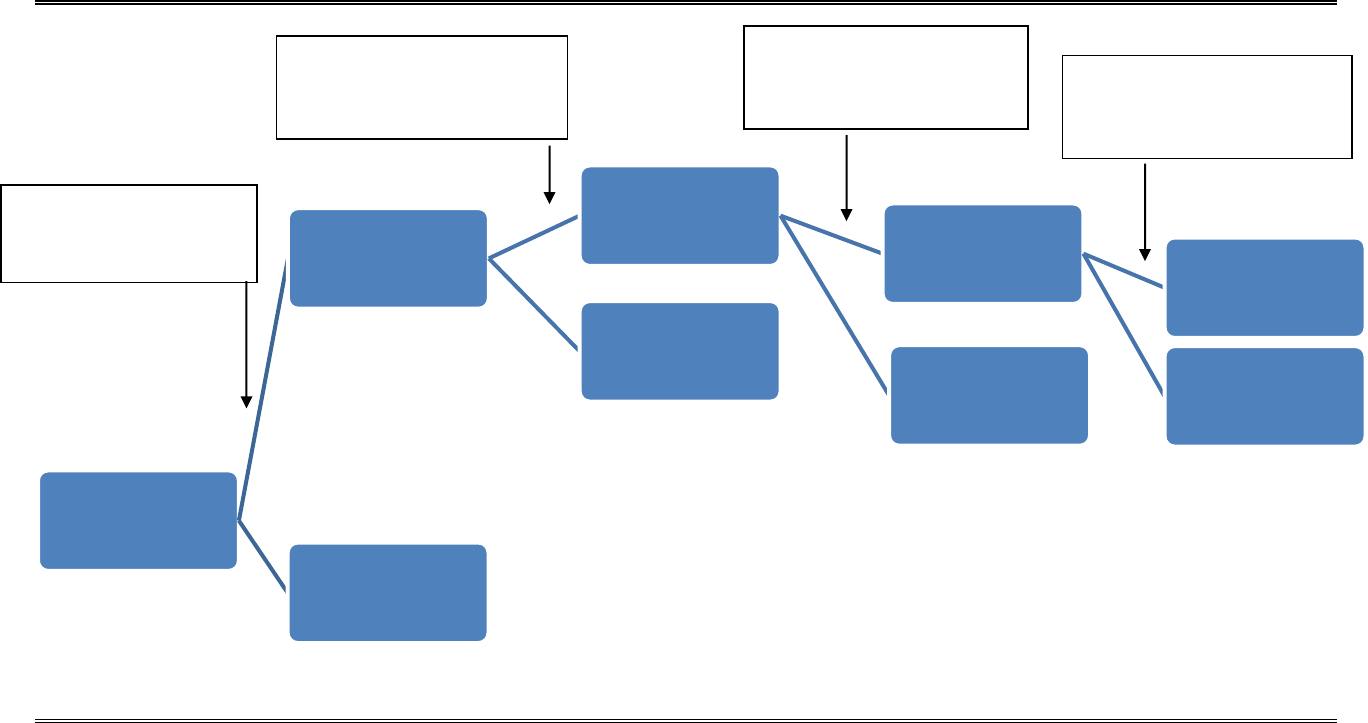
Diagram 1 displays the choices made in the sample of 1,618 speeding ticket cases and
illustrates the sample size at each decision stage, as defined in Section II. The majority of
individuals (67%) choose to pay their fines initially by mail or at the ticket windows. Of those
who do not pay at the window at Stage 1, few individuals receive a deal at arraignment (8%).
13
To protect the anonymity of the judges, I call this variable “Judge A.” This variable equals 1 for one of the two
judges and 0 for the other. The letter “A” is not an identifiable piece of information.
14
Socioeconomic variables were collected from the 2000 Census Demographic Profile Highlights by zip code.
Miles to the courthouse and minutes from the courthouse were collected using Google maps from the home zip code
to the Lafayette City Courthouse address: 105 E. Convent Street Lafayette, LA 70501.
15
A total of 1,707 tickets were issued between August 2007 and February 2008, however, the sample used in the
present study excludes some of these tickets because the drivers are different in unobservable ways. Individuals
who choose jail time or are allowed to perform community service instead of paying their fine (12), those who
receive the maximum deal from the prosecutor (54), and individuals who never pay or take care of their speeding
tickets are not included in the estimation sample (23).

Quintanar 14
Those who do not get a deal then face Stage 3; they must decide if they would like to keep
fighting their ticket by attending a trial or if they would rather “give up” and pay the fine. Most
individuals stop fighting the ticket and pay their fine (89%). Again, in the last stage, the majority
of individuals do not receive a deal from the prosecutor (72%).
Table 1 presents means and standard deviation of the control variables overall, and for
each stage of the court process. Approximately half of the ticketed drivers are female, whereas
only 27% are African-American.
16
The majority of drivers were traveling between 11 and 15
miles over the speed limit when ticketed, and about 38% of tickets were issued for speeding in a
school zone. Very few drivers received other tickets in addition to the speeding ticket when they
were stopped, and the majority of drivers had not received a speeding ticket in the past year (a
mean of .471 prior violations). A little less than half of drivers are assigned to Judge A.
17
Some major differences can be seen in the average number of African-Americans and
women by stage; the proportion of African-Americans increases as the stages progress, while the
percentage of women decreases. More severe violators comprise a larger proportion of drivers
as they progress from Stage 1 to Stage 3, and drivers who received other tickets in addition to
their speeding ticket are more prevalent once we reach Stage 4.
The raw data suggest that police are not statistically discriminating against women or
African-Americans on the basis of likelihood to fight a ticket, since women seem to be just as
likely as men to pay their tickets immediately, but less likely to attend trial. Conversely,
African-Americans actually seem to be more likely to contest their ticket at both stages.
16
In 2000 the fraction of African-Americans in Lafayette was 28.5% (Census Bureau fact sheet for Lafayette, LA).
In 2009, it was 31.1%, therefore, the 27% is only slightly lower than the underlying population (American
Community Survey 2005-2009 estimates).
17
Judge A is a fictional identifier of one judge versus the other and is not an abbreviation for the name of the judge.
Though all drivers are assigned to one of the two traffic court judges when issued a ticket, individuals are not aware
of their assignment until they attend an arraignment hearing.
Quintanar 15
Statistical discrimination implies that police would target drivers who are more likely to pay their
tickets outright, thereby avoiding court costs associated with trials. However, considering simple
means alone is not sufficient to test for statistical discrimination.
IV. Results
1. Probit Models Assuming Independent Error Terms
The initial analysis of court behavior is presented in Tables 2A and 2B: where the entries
are marginal effects for Stages 1-4 estimated by independent probit equations. This specification
is valid if the error terms are not correlated across equations. It is reasonable, as an initial
investigation, to assume that each decision is independent, since individuals make choices at
Stages 1 and 3 while prosecutors make decisions at Stages 2 and 4. Similarly, an individual may
use completely different criteria in deciding whether to fight their ticket in Stage 1 and Stage 3,
especially if they view trials and arraignments as two distinct events. If this is the case, the error
terms for these equations should not be correlated. Supportive evidence of independence will be
provided in a later sub-section.
In Tables 2A and 2B, all equations control for driver characteristics, violation
characteristics, and court-related variables. The second and fourth columns add controls for
socioeconomic characteristics. The signs of the coefficients for a majority of controls coincide
with theoretical predictions, although some driver characteristics and court-related variables are
insignificant.
In Stage 1 African-Americans are consistently more likely to fight the ticket, while there
is no effect based on gender or age. This contradicts the proposition that police statistically
discriminate against African-Americans and women because they might be more likely to pay a
speeding ticket (Quintanar, 2011). According to these results, African-Americans are less likely

Quintanar 16
to pay their tickets and women behave no differently than men. Police cannot be statistically
discriminating based on likelihood to pay tickets since they are ticketing individuals who are not
more likely to pay their fines. Therefore, the results found in Quintanar (2011) cannot be based
on statistical discrimination and may indicate police are ticketing individuals due to preference
based discrimination. Potential other discrimination stories will be explored later in the paper.
Drivers committing less severe violations are less likely to fight their tickets than their
speedy counterparts (the omitted category represents those individuals traveling more than 21
miles over the limit). However, drivers who were ticketed in a school zone were much more
likely to attend an arraignment to fight the ticket. Individuals who received another ticket at the
traffic stop where they were cited for speeding were consistently more likely to attend an
arraignment, which is logical since those individuals have more to gain by attempting to receive
a deal from the prosecutor. In Stage 1, no socioeconomic controls were significant and neither
was the judge indicator.
18
Stage 2 results are similar to Stage 1, though their interpretation is quite different. The
marginal effect of being African-American is positive and significant, which implies that
African-Americans are more likely to not receive a deal from the prosecutor than drivers of other
races. There is no significant difference between the likelihood of men and women to receive a
deal. This provides little insight into the investigation of statistical discrimination. However,
African-Americans should be less likely to fight their tickets if they know they have a smaller
likelihood of receiving a deal. This finding does not necessarily imply discrimination by
prosecutors, but could instead be a result of different rates of asking by African-Americans and
individuals of other races. The present study cannot distinguish between these two scenarios.
18
This is unsurprising since drivers are not aware which judge they are assigned until they attend an arraignment.
Quintanar 17
While it is reasonable to assume that individuals in Stages 1 and 3 who have higher
incomes are less likely to fight a ticket due to higher opportunity costs of time, the influence of
higher incomes on prosecutors’ decisions is less clear. Prosecutors may be harsher on those with
higher incomes because these individuals are more able to afford their fines, or because the
prosecutor believes these individuals are more likely to continue to speed. Conversely,
prosecutors may treat wealthy individuals more leniently, which likely results from political
status or influence within the court. Income is generally insignificant in the estimation results,
but when significant it seems that prosecutors are actually more likely to grant deals to
individuals from wealthier neighborhoods.
Table 2B presents the results for Stages 3 and 4. In Stage 3, the marginal effect of being
African-American remains positive and significant, though it is much smaller in magnitude (.053
as opposed to .141). Therefore, African-Americans are still more likely to choose to fight their
speeding ticket but racial disparity in behavior is smaller. This could be a result of the
differences between attending an arraignment and attending a trial. Once more, gender and age
are insignificant. These results again contradict the theory that police statistically discriminate
based on likelihood to contest.
One interesting difference in Stage 3 is that the coefficient on Judge A is positive and
statistically significant. Individuals who are assigned to Judge A are more likely to ask for a
trial. In later sections I explore whether this occurs in response to differential fines assigned by
the judges, or if it is due to some other unobservable difference between the two judges.
In Stage 4, the coefficient on African-American is positive, but only significant in the
regression with fewer controls. This implies that African-Americans are more likely not to
receive a deal at trial, but again, could result from prosecutorial discrimination or a difference in
Quintanar 18
asking. It is important to note that controls in Stage 4 are generally consistent with theoretical
predictions; however, the sample size is only 32 so not much should be inferred from these
results. They are provided for completeness.
2. Independent Probit Models Including Probability of Continuing in the Next Stage
Recall that the court process is defined in four stages: two as “driver choice” and two as
“prosecutor choice.” However, the meaning attributed to these titles needs clarification: each
stage may not necessarily be independent, and theoretically they each could have a forward-
looking component. For instance, in Stage 1 a driver’s decision of whether to fight their ticket
or pay immediately may be impacted by the likelihood of their receiving a deal in the following
stage. This forward-looking component can be defined simply as the probability of a driver
continuing on in the court process in the next stage (for instance, in Stage 1, the probability of
continuing on in the court process in the next stage is the likelihood that the driver does not
receive a deal in Stage 2). There is a simple way to test whether predicted “performance” in the
next stage is a factor in the decision made in the present stage.
These probabilities of continuing are estimated conditionally, beginning with Stage 4. A
probit model for Stage 4 is estimated and used to predict likelihood of not receiving a deal for the
entire sample. Next, a probit model for Stage 3 is estimated including the predicted likelihood of
not receiving a deal in Stage 4. If this predicted probability in Stage 3 is statistically significant,
it implies that individuals decide whether to attend a trial in part based on the likelihood of
receiving a deal in Stage 4. These results are then used to predict the likelihood of a driver
fighting their ticket in Stage 3, for the entire sample. This procedure is continued for the
remaining stages.
Quintanar 19
Theoretically, the coefficient on the probability of continuing should be negative for
driver decision stages (Stage 1 and Stage 3). Expanding upon the above example of Stage 1’s
probability of continuing, an individual who has a very high likelihood of not receiving a deal in
Stage 2 (a very high probability of continuing in the next stage) should be less likely to fight
their ticket because of the high likelihood that they are wasting their time. Conversely, someone
who has a low probability of not receiving a deal should be more likely to fight their ticket,
because there is a large chance they will get a reduced charge.
In Stage 2, the prosecutor decision stage, the relationship between the probability of
continuing in the next stage and likelihood of not receiving a deal in the current stage may be
negative or irrelevant. If prosecutors are concerned with minimizing court costs and their own
time costs, they will be more willing to grant a deal to an individual who seems likely to
continue fighting their ticket in Stage 3 (Reinganum 1988). Therefore, if the probability of
continuing on through Stage 3 is large (the driver is very likely to fight the ticket and go to trial),
then the prosecutor is going to be less likely to not grant a deal to the driver in Stage 2 (the
probability of continuing will be negative). However, if the prosecutor’s motives to avoid
spending resources in court are outweighed by their desire to punish the guilty, they will be
unwilling to grant deals based on the likelihood of a driver fighting their ticket. This could still
result in a negative probability of continuing in the next stage, but the probability should be
insignificant.
Table 3 provides marginal effects for this model estimated as independent probit
equations by stage, including the predicted probability of continuing for each individual in the
following stage. The overall results are similar to findings from Tables 2A and 2B. African-
Quintanar 20
Americans are more likely to fight their ticket in both Stage 1 and 3, while they are more likely
to not receive a deal in Stage 2. Again, gender and age are insignificant in all stages.
In Stages 1 and 3, the sign of the probability of continuing is negative, consistent with
theory, although estimated imprecisely for Stage 1. This probability is only significant in Stage
3, implying that drivers consider their likelihood of receiving a deal at trial, but may not really
use this information when deciding whether to attend an arraignment. It may also be the case
that drivers at Stage 3, since they have more information about the prosecutor than they did at
Stage 1, have a better understanding of how prosecutors decide to grant deals and thus are better
able to predict their likelihood of success in the next stage.
Stage 2 provides slightly different results than the driver decision stages; the probability
of continuing in the next stage is insignificant and positive. These results imply that prosecutors
are not influenced by driver behavior, and instead issue deals based on violation and
socioeconomic characteristics as seen in Tables 2A and 2B.
Though the probabilities are consistent with theory, note that each is estimated using an
out of sample prediction. For example, individuals who choose to attend a trial are observed in
Stage 3, and the probability of attending trial is estimated by using this subsample. This
probability is predicted for all individuals in Stage 2, even those who choose not to attend trial
and were no longer observed in the data in Stage 3. These drivers made the decision to pay their
ticket instead of attending trial because they had a low expected benefit of continuing on in the
court process, but their predicted probabilities will be based on the sample of individuals who
had high expected benefits of contesting. This over-estimation as well as the fact that these
probabilities are measured with error results in estimates which suffer from attenuation bias.
Quintanar 21
3. Assuming Correlated Error Terms: A Selection Model
As previously mentioned, independent probit estimates are appropriate only if the
driver/prosecutor decision is unrelated to the decision made in the previous stage, or if each
stage’s error term is uncorrelated. This section aims to investigate the accuracy of this
assumption, by estimating a model of selection where the equations are in essence linked
together through a selection equation. This specification is relevant if for example, an
unobserved driver characteristic impacts the driver’s decision not to pay at the window and is
also correlated with a control in the prosecutor’s decision to grant a deal at arraignment.
Table 4 relaxes the assumption of independent error terms between stages: assuming first
that the error terms for Stages 1 and 2 are related, and secondly assuming Stages 2 and 3 are
related. This estimation strategy, linking two subsequent stages instead of the entire model, has
been employed extensively in the criminology literature to investigate sentencing for numerous
crimes: sexual assault offenders, intimate assault, juvenile crimes (Wooldredge and Thistlewaite
2004 and Kingsnorth et al. 1998, for example).
The following is the specification employed in Table 4 for Stages 1 and 2, which merely
links equations (3) and (5):
Selection Model for Stages 1 and 2 (8)
Selection equation
Quintanar 22
The basic controls, which were employed in previous tables, are also included in
and
: violation and driver characteristics, as well as socioeconomic variables. However, forced
arraignment, driver is from a small city, in state, eligible for driving class, and received ticket in
home zip code are used as instruments to aid identification of the selection model. A likelihood
ratio test of independent equations is performed, and estimates for are presented (for Stages 1
and 2 as well as Stages 2 and 3). In both model specifications the null of =0 cannot be rejected.
Forced arraignment and driver is from a small city are excluded from Stage 2 to aid in
identification of the selection model. By law, individuals ticketed for travelling more than 25
miles over the limit or those ticketed in a school zone for traveling more than 10 miles over the
limit must attend an arraignment and are ineligible to pay their tickets by mail or at a ticket
window. A dummy variable, forced arraignment, is included in Stage 1 to control for this lack
of choice. By Stage 2, being forced to attend an arraignment has no further impact on outcomes,
because court procedure is not mandated past the first stage. Relatedly, conditional on the
prosecutor knowing an individual was speeding in a school zone or was travelling more than 10
miles over the limit, the fact that the individual was required to attend an arraignment should not
factor into the prosecutor’s mind. Also, there is no reason to believe that individuals will use this
requirement as a factor in deciding to attend trial (therefore is irrelevant in Stages 2-4).
Driver is from a small city is an indicator for whether the driver is from a city with fewer
than 10,000 residents. Ticketed drivers from small cities may have different beliefs about how
courthouses function than individuals from large cities. For instance, drivers from small cities
may know their own court officials, and thus may be less intimidated by courts in general
(especially since Lafayette, though not very small, is not considered a big city). This could
Quintanar 23
influence the driver’s initial belief about success in fighting a ticket, and they may be more likely
to attend the initial arraignment.
Prosecutors have information about where drivers are from, however, it is unlikely they
know (or care) how many residents a city has. Conversely, the prosecutor is more likely to be
influenced by distance that the driver must travel and not by the size of the city itself. There is
no theoretical reason why this variable should impact the prosecutor’s decision in Stage 2. Upon
reaching Stage 3 of the court process, drivers have had some experience with Lafayette city court
to make an informed decision on whether to attend a trial, and where they are from should no
longer be relevant.
Stages 2 and 3 are linked in the same way as Stages 1 and 2 (see equation (8)). I employ
the following instruments: in state, eligible for driving class, and received ticket in home zip
code. In state is an indicator for whether a driver has a license from Louisiana. This instrument
can be excluded from Stage 3 because; conditional on travel time to court (already included in
the model) individuals should not base the decision to attend trial on the state they live in.
However, since police are more likely to ticket out of state drivers (Makowsky and Stratman
2009), prosecutors may consider the state where the driver’s license is issued at the initial
arraignment. Though in state is important in Stage 2, there is no theoretical reason it needs to be
included in Stage 3.
Received ticket in home zip code is an indicator equal to 1 if the driver was ticketed in the
zip code where they live. This can only equal one for residents of Lafayette, since all tickets are
issued within the city limits. However, residents of Lafayette may also receive tickets in zip
codes other than where they live. If prosecutors are more forgiving or harsh to individuals who
were speeding in a very familiar area, being ticketed in their own zip code may impact the
Quintanar 24
driver’s likelihood of receiving a deal (Stage 2). Otherwise, it is unlikely that individuals
fighting a speeding ticket are going to decide whether or not to attend a trial (Stage 3) merely
based on being ticketed in their own zip code versus another.
In Louisiana, an individual has the option to take a defensive driving course once a year
to “erase” a speeding ticket from their record, and in so doing, avoid associated insurance
increases resulting from the violation. Only drivers who were ticketed for traveling less than 25
miles over the limit and who have not received another violation in the past year are eligible to
take this course (eligible for driving class). According to representatives of the court, this
control is especially relevant in deal issuance because prosecutors have a tendency to grant deals
to ineligible individuals to enable them to take the driving course. For example, assume an
individual who was ticketed for traveling 26 miles over the limit receives a lesser charge of
traveling 24 miles over the limit. This driver will now be eligible to take a defensive driving
course. Therefore, eligible for driving class is important in Stages 1 and 2. By Stage 3,
eligibility for driver course will have been accounted for at arraignment and no longer should
affect an individual’s decision to go to trial.
Table 4 presents estimates of the selection models estimated by full information
maximum likelihood, where Columns II and IV list conditional marginal effects. First, looking
at Columns I and II, where Stages 1 and 2 are assumed to be related, African-Americans are still
less likely to pay at the window initially and more likely not to receive a deal in Stage 2, though
now only the first difference is statistically significant. These results are consistent with the
main result, which is that police are not statistically discriminating against African-Americans
based on likelihood to contest. However, the lack of significance in Stage 2 differs from
previous results. Recall that the significant racial effect found in earlier specifications could be a
Quintanar 25
result of a difference in asking or prosecutorial discrimination, which is still the case here, except
that the Stage 2 marginal effects are calculated based on the conditional likelihood. There is no
difference when considering gender or age.
As before, African-Americans are more likely not to receive a deal in Stage 2, and are
more likely to continue to trial in Stage 3. There is still no significant difference in comparing
the behavior of women to the behavior of men in dealing with their tickets and age controls
remain insignificant as well. Therefore, even controlling for selection effects, evidence for
statistical discrimination by police on the basis of likelihood to contest a speeding ticket cannot
be supported.
Besides the marginal effects estimates, estimates for rho are also presented. For both
selection models, rho is insignificant, and the null hypotheses of the likelihood ratio test of
independent equations cannot be rejected. Though this does not rule out correlation between the
errors, this provides suggestive evidence that the previous estimates assuming independence may
not be biased. If the error terms are not related, it is appropriate to estimate the process by
individual probits as in Tables 2A and 2B (Greene 2008).
V. Additional Questions
1. Are Driver Behavioral Differences Driven by Differences in Fines Issued by Judges?
As was seen in the previous section, individuals alter their behavior based on which judge
they face at arraignment (the same judge that will preside during the trial). This is intriguing,
and the next step is to determine if this behavior is a response to differential fine issuance by
judges and whether those differences are motivated by race or gender. Fines in traffic court are
legally dictated by a fee schedule. However, judges have the ability to alter fines of drivers who

Quintanar 26
attend arraignments and/or trials.
19
Previous literature has found that judges alter sentences
and/or fines based on the race and gender of the offender as well as the race and gender of the
victim (Schanzenbach 2005, for example).
The fine schedule is officially based on the speed traveled over the limit, whether the
ticket was in a school zone, and the number of previous violations the driver has on his record.
The fine schedule is not public information, and the court will not release the actual rule for
assigning fines. However, controlling for the factors which determine fines should provide the
information necessary to investigate the extent that judges deviate from the fine schedule.
In order to investigate whether judges impose fines differentially, Table 5 investigates
determinants of fines assigned to drivers who face the judge. The severity of the speed violation
is the main component of the fine amount: someone traveling 5 to 10 miles over the limit would
receive a fine that was about 54 dollars less than a severe speeder (who travelled more than 20
miles over the limit). Similarly, individuals who were speeding in a school zone pay slightly
over $8 more on average. Past violations are not significant. A control is included for
individuals who owe the court money for prior charges, and individuals’ fines increase by
approximately the amount of those previous charges (eg. a prior charge of $10 increases the fine
by $9.22 in the first column).
Column II adds controls for other violation characteristics which may influence the fine
in court. Then, Column III adds demographic and socioeconomic characteristic controls. The
only significant violation characteristic is whether the driver was eligible for a driving course (if
so, their fine was almost $12 less). African-Americans pay about $3 less in fines than white
individuals. This is statistically significant; however, the average fine is $145.77, so this racial
19
This information was obtained from a representative of Lafayette City Court, but the fine schedule itself is not
publicly available information.

Quintanar 27
difference amounts to about 2%. Similarly, older individuals pay significantly less, but only by
about 60 cents per year.
20
None of these controls should be significant if the fines are truly
determined by a fixed schedule. However, these results show that judges are not issuing fines in
a discriminatory manner.
21
The final column adds the indicator for judge assignment, and the coefficient is
insignificant, implying that drivers who face Judge A do not receive significantly different fines
than those who face the other judge, all else equal. We previously saw that individuals who face
Judge A are more likely to continue to trial, which seems to imply they expect a better outcome
from Judge A. Since the fine amounts do not differ based on the judge, some unobservable
judge characteristics may explain this behavior. If Judge A is less intimidating or more friendly,
then individuals may not experience as much discomfort in having to face Judge A and thus may
be more willing to attend trial.
22
IV. Conclusion
The primary goal of this paper is to determine whether statistical discrimination or
preference-based discrimination is the motive behind police issuing a greater proportion of
speeding tickets to African-Americans and women. The existing research on police
discrimination in traffic stops, searches, and ticketing finds inconsistent results regarding racial
as well as gender based discrimination (Blalock et al. 2007, Makowsky and Stratmann 2009,
Knowles and Todd 2007, Grogger and Ridgeway 2006). For example, Knowles et al. (2001)
20
One possible explanation for this age difference is that the court may wish to punish young violators more
severely in an attempt to prevent recidivism. This has been cited as a common influence in the court system (ex.
Wooldredge and Thistlethwaite (2004)).
21
This illustrates that the judges as a whole do not discriminate. I also estimate fine determinants on restricted
samples by race and gender of the ticketed driver to ensure that neither judge individually is discriminating. Again,
there is no indication that either judge considers race or gender when assigning speeding fines. These results can be
provided upon request.
22
The current paper excludes individuals who received the maximum deal from the prosecutor (where the ticket was
completely dropped), but even when these individuals are considered, there is no difference in receiving the
maximum deal based on the judge you were assigned to for trial.
Quintanar 28
show that police engage in statistical discrimination when searching vehicles for drugs, however,
using the same data Antonovics and Knight (2009) provide evidence that police are actually
discriminating based on preferences.
The present paper expands upon Quintanar (2011), which found police issue a greater
proportion of speeding tickets to African-Americans and women than automated sources. Using
the same police ticket data, appended with individual court outcomes, I investigate whether
police are engaging in statistical discrimination based on a driver’s likelihood to pay a speeding
ticket as opposed to fighting the ticket through several stages of the court process.
If police have an interest in saving the court money and eliminating their requirement to
attend a hearing, the officers should ticket individuals who are more likely to pay their tickets
outright. This would be statistical discrimination; however, by analyzing individual driver
behavior throughout the court process of dealing with a speeding ticket, I find evidence to the
contrary. African-Americans are less likely to pay their tickets immediately, and more likely to
fight their tickets through the entire court process by attending a trial.
Relatedly, there is no significant difference between women and men’s behavior in
fighting tickets. Again, statistical discrimination does not coincide with women being more
likely to receive tickets (Quintanar 2011). Therefore, no “advantage” exists in targeting either
gender when issuing speeding tickets and a higher ticket frequency for African-Americans
actually uses more court resources. This evidence diminishes the likelihood of statistical
discrimination as a viable explanation for police behavior, but further analysis is required to
determine whether police are engaging in preference based discrimination or are issuing a greater
proportion of speeding tickets to women and African-Americans for some other unknown
reason.
Quintanar 29
The unique dataset employed in this paper allows the researcher to account for many of
the variables which influence driver and prosecutor behavior in the court process. It does not
seem to be the case that unobservable variables are driving both individual and prosecutorial
choices at different stages, and in fact, evidence has been provided to illustrate that these
decisions are actually independent. This is the first paper to explore individual choices in
dealing with a speeding ticket throughout the entire court process, along with prosecutorial
decisions and judge behavior. Similarly, due to the uniqueness of the dataset, this research does
not suffer from two of the most common issues in this realm of literature: nonreporting and post-
lawsuit data. The data were collected directly from the courthouse database without the prior
knowledge of police and thus there is no reason to suspect ticketing behavior was altered. In the
same way, nonreporting is not a concern since the data include all police issued-speeding tickets
during the sample time period.
Similar to previous research, the present paper investigates prosecutor decisions as well
as judge sentencing. African-Americans are generally less likely to receive a deal than white
defendants, both when initially meeting with the prosecutor and when meeting with the
prosecutor a second time at trial. It is tempting to interpret this finding as prosecutorial
discrimination based on race, but as a result of the data structure this finding may simply
illustrate a racial difference in the rate of asking for deals. The data indicate only whether an
individual attended a hearing, and not if they spoke to the prosecutor and requested a deal. The
question of prosecutorial discrimination is beyond the scope of this paper, but its implications for
present and future work should be considered.
If the prosecutors in Lafayette City Court have a widespread pattern of discriminatory
behavior against certain groups, ticketed drivers may form expectations about the likelihood of

Quintanar 30
receiving a deal with this behavior pattern in mind. Because African-Americans are less likely to
receive a deal, they may be less willing to invest time and effort into contesting the ticket. If this
were the case, police would be aware that African-Americans were more likely to pay instead of
fighting a ticket, and may statistically discriminate for this reason. However, the findings show
that African-Americans are actually less likely to pay, which is in opposition to this theory. If
discrimination by the prosecutor exists, it should not alter the implications for the current result
that statistical discrimination does not seem to explain why police target women and African-
Americans in issuing speeding tickets.
23
Analyzing speeding fines is a useful way to analyze judge behavior, since judges in
Lafayette City Court are able to change fines based on their discretion. Though violation
characteristics are very important in determining the amount of a speeding fine, older individuals
receive lower fines after facing a judge and prosecutor. African-Americans also pay lower fines
after facing a judge or talking to the prosecutor.
Interestingly, individuals seem to behave differently depending on which judge they face
in traffic court, but their motives for doing so are unclear. One possibility is that individuals
perceive one judge as more pleasant or less intimidating, and thus their expected cost of
continuing to trial is lower. In this example, people may be more willing to attempt to get a
lower fine when facing the “nice” judge. Even if this is the underlying cause for differences in
decisions of ticketed drivers, there is no difference in driver outcomes based on which particular
judge is faced in court. Therefore, this differing driver behavior does not seem to be a result of
leniency by any one judge. The true motive for driver behavior in regards to the judge is a
23
One related theory is that African-Americans fight their tickets, knowing that prosecutors behave discriminatorily,
because they expect fairness from the judge at trial. African-Americans who do not pay initially do pay a
statistically significantly lower fine than other races of drivers, all else equal (though the monetary difference is
quite small). This theory cannot be fully investigated due to the structure of the data, since we cannot distinguish
whether the prosecutor is behaving in a discriminatory manner.
Quintanar 31
question for future research, since for now we cannot explain different individual choices, but
can only determine that the judges are not behaving discriminatorily.
Quintanar 32
In Sample:
Receive Ticket
100%
1618
Did Not Pay at the Window
33%
538
No Deal at Arraignment
92%
493
Went to Trial
11%
53
No Deal at or Before Trial
72%
38
Received a Deal at or Before
Trial and Paid Fine
28%
15
Pay Ticket
89%
440
Received a Deal at
Arraignment and Paid Fine
8%
45
Pay at the Window
67%
1080
Diagram 1: Decision Tree
The figure above illustrates choices of 1,618 individuals through the court process, once receiving a speeding ticket. Stages are denoted at relevant
decision nodes, and each box contains a description of the choice made as well as two numbers: the percentage of the sample choosing that option
and the sample size.
Stage 1:
Driver Decision to
Attend Initial Hearing
Stage 2:
Prosecutor Decision to Grant
a Deal
Stage 3:
Driver Decision to Request
a Trial
Stage 4:
Prosecutor Decision to Grant
a Deal (At or Before Trial

Quintanar 33
Table 1:
Means and Standard Deviation by Stage
Variable
Entire Sample
Stage 1
Stage 2
Stage 3
Stage 4
=1 if Driver
Attends
Arraignment,
=0 if Pays
=1 if No
Deal, =0 if
Deal
=1 if Driver
Attends
Trial, =0 if
Pays
=1 if No
Deal, =0 if
Deal
Driver Identifiers
African-
American
.267
(.443)
.259
(.438)
.344
(.476)
.364
(.482)
.469
(.507)
Female
.505
(.500)
.518
(.500)
.502
(.501)
.492
(.500)
.406
(.499)
Age
31.214
(12.766)
31.178
(12.678)
30.451
(12.326)
30.395
(11.973)
35.531
(13.464)
Age Squared
1137.193
(996.873)
1132.69
(988.001)
1078.913
(974.818)
1066.865
(927.798)
1438.094
(1003.986)
Violation Identifiers
Past Violations
.471
(.997)
.468
(.976)
.496
(1.077)
.523
(1.110)
.5
(1.459)
Five to 10
Miles Over
.034
(.181)
.035
(.183)
.026
(.160)
.022
(.147)
.094
(.296)
Eleven to 15
Miles Over
.472
(.499)
.469
(.499)
.273
(.446)
.266
(.442)
.313
(.471)
Sixteen to 20
Miles Over
.393
(.489)
.393
(.489)
.547
(.498)
.561
(.497)
.406
(.499)
More than 21
Miles Over
.101
(.302)
.103
(.304)
.154
(.361)
.151
(.358)
.188
(.397)
School Zone
.379
(.485)
.395
(.489)
.605
(.489)
.632
(.483)
.313
(.471)
Driving History and Judge Identifier
Another Less
Severe Ticket
.062
(.242)
.060
(.238)
.091
(.288)
.091
(.288)
0
(0)
Another More
Severe Ticket
.030
(.171)
.025
(.155)
.069
(.253)
.073
(.261)
0
(0)
Judge A
.462
(.499)
.457
(.498)
.466
(.499)
.475
(.500)
.656
(.483)
Identifiers Based on Driver’s Home Zip Code: Opportunity Cost Proxies
Lafayette
Resident
.593
(.491)
.603
(.489)
.587
(.493)
.581
(.494)
.531
(.507)
High School/Some
College
.539
(.052)
.539
(.052)
.540
(.050)
.541
(.049)
.541
(.051)

Quintanar 34
Table 1, Concluded:
Means and Standard Deviation by Stage
Variable
Entire Sample
Stage 1
Stage 2
Stage 3
Stage 4
=1 if Driver
Attends
Arraignment,
=0 if Pays
=1 if No
Deal, =0 if
Deal
=1 if Driver
Attends
Trial, =0 if
Pays
=1 if No
Deal, =0 if
Deal
College Degree
or Higher
.236
(.133)
.238
(.133)
.221
(.128)
.215
(.124)
.206
(.127)
Log Per Capita
Income
9.787
(.286)
9.791
(.286)
9.748
(.274)
9.734
(.266)
9.716
(.283)
Miles from
Courthouse
19.304
(55.985)
17.393
(48.548)
16.951
(57.374)
16.916
(58.916)
21.219
(38.862)
45-90 Min.
Drive to Court
.057
(.232)
.056
(.229)
.053
(.224)
.049
(.216)
0
(0)
>90 Min. Drive
to Court
.052
(.222)
.041
(.199)
.036
(.188)
.038
(.191)
.094
(.296)
N
1495
494
451
32
Means and standard deviations are estimated based on the sample from Tables 3A and 3B for consistency.
Two controls predict success perfectly for Stage 4: Another Less Severe Ticket and Another More Severe
Ticket. For all individuals who receive another ticket in addition to their speeding ticket, they do not
receive a deal from the prosecutor in Stage 4.

Quintanar 35
Table 2A: Probit Model Assuming Independent Errors Between Decision Stages
Stage 1
Stage 2
=1 if Driver Attends Arraignment, =0 if Pays
=1 if No Deal, =0 if Deal
African-American
.166**
(.031)
.141**
(.033)
.060**
(.019)
.044**
(.016)
Female
-.015
(.026)
-.012
(.026)
-.028
(.020)
-.024
(.018)
Age
.001
(.006)
-.001
(.006)
.006
(.004)
.005
(.003)
Age Squared
-.000
(.000)
-.000
(.000)
-.000*
(.000)
-.000
(.000)
Past Violations
.015
(.013)
.017
(.013)
.029*
(.014)
.027*
(.014)
5 to 10 Miles Over
-.182**
(.052)
-.184**
(.051)
-.036
(.072)
-.032
(.066)
11 to 15 Miles Over
-.361**
(.037)
-.362**
(.037)
-.021
(.034)
-.007
(.029)
16 to 20 Miles Over
-.098**
(.039)
-.096**
(.039)
.015
(.031)
.020
(.028)
School Zone
.329**
(.026)
.329**
(.026)
.092**
(.029)
.073**
(.025)
Another Less Severe Ticket
.152**
(.059)
.151**
(.059)
-.029
(.052)
-.035
(.051)
Another More Severe Ticket
.635**
(.048)
.634**
(.050)
.052
(.019)
.042
(.017)
Judge A
.013
(.026)
.017
(.026)
.028
(.020)
.021
(.018)
Lafayette Resident
-.003
(.043)
-.014
(.031)
High School/Some College
-.060
(.332)
.566**
(.256)
College Degree or Higher
-.064
(.519)
.713**
(.383)
Log Per Capita Income
-.075
(.211)
-.366**
(.155)
Miles from Courthouse
.000
(.000)
.000
(.000)
45-90 Min. Drive to Court
-.058
(.051)
-.109*
(.079)
>90 Min. Drive to Court
-.089
(.072)
.042
(.016)
N
1511
1495
500
494
ln L
-770.19
-757.12
-129.15
-117.41
The coefficients are marginal effects. The models are estimated with robust standard errors.

Quintanar 36
Table 2B: Probit Model Assuming Independent Errors Between Decision Stages
Stage 3
Stage 4
=1 if Driver Attends Trial, =0 if Driver Pays
=1 if No Deal, =0 if Deal
African-American
.042*
(.027)
.053**
(.029)
.453*
(.203)
.207
(.269)
Female
-.026
(.024)
-.025
(.023)
-.145
(.213)
-.211
(.248)
Age
.003
(.005)
.004
(.005)
.087
(.077)
.047
(.077)
Age Squared
-.000
(.000)
-.000
(.000)
-.001
(.001)
-.001
(.001)
Past Violations
-.009
(.013)
-.007
(.012)
.162
(.181)
.309
(.209)
5 to 10 Miles Over
.185*
(.153)
.206*
(.155)
.473**
(.124)
.308
(.222)
11 to 15 Miles Over
.018
(.040)
.026
(.039)
.394
(.210)
.168
(.244)
16 to 20 Miles Over
.005
(.035)
.006
(.033)
.534**
(.206)
.194
(.277)
School Zone
-.117**
(.034)
-.119**
(.033)
.231
(.240)
.463
(.195)
Another Less Severe Ticket
.073
(.057)
.068
(.054)
-
-
Another More Severe
Ticket
.157**
(.080)
.168**
(.083)
-
-
Judge A
.052**
(.024)
.051**
(.024)
.088
(.229)
.083
(.248)
Lafayette Resident
-.043
(.039)
.172
(.468)
High School/Some College
.248
(.279)
5.910*
(3.088)
College Degree or Higher
.620
(.454)
5.711
(5.223)
Log Per Capita Income
-.223
(.191)
-2.164
(2.129)
Miles from Courthouse
-.000
(.000)
.022
(.024)
45-90 Min. Drive to Court
-.050
(.026)
-
>90 Min. Drive to Court
.099
(.100)
-.892
(.165)
N
455
451
32
32
ln L
-127.73
-124.60
-15.24
-14.23
Probit marginal effects are listed, with robust standard errors. Two controls predict success perfectly for Stage 4: Another Less
Severe Ticket and Another More Severe Ticket. For all individuals who receive another ticket in addition to their speeding
ticket, they do not receive a deal from the prosecutor in Stage 4. The control for living 45-90 minutes from the courthouse is
dropped due to collinearity in Stage 4.

Quintanar 37
Table 3: Independent Probit Model, Including Probability of Continuing in the Next Stage
Stage 1
Stage 2
Stage 3
Stage 4
=1 if Driver Attends
Arraignment, =0 if Pays
=1 if No Deal, =0 if
Deal
=1 if Driver Attends Trial,
=0 if Pays
=1 if No Deal, =0 if
Deal
African-American
.159**
(.039)
.039**
(.017)
.066**
(.031)
.207
(.269)
Female
-.023
(.028)
-.020
(.019)
-.035
(.023)
-.211
(.248)
Age
.001
(.006)
.004
(.004)
.006
(.005)
.047
(.077)
Age Squared
-.000
(.000)
-.000
(.000)
-.000
(.000)
-.001
(.001)
Past Violations
.024
(.016)
.030**
(.014)
.001
(.012)
.309
(.209)
5 to 10 Miles Over
-.194**
(.049)
-.070
(.111)
.255**
(.168)
.308
(.222)
11 to 15 Miles Over
-.365**
(.037)
-.011
(.029)
.041
(.040)
.168
(.244)
16 to 20 Miles Over
-.088**
(.040)
.018
(.027)
.021
(.030)
.194
(.277)
School Zone
.356**
(.037)
.089**
(.038)
-.076**
(.032)
.463
(.195)
Another Less Severe
Ticket
.133**
(.061)
-.039
(.053)
.129**
(.071)
-
Another More Severe
Ticket
.642**
(.048)
.037
(.022)
.267**
(.107)
-
Judge A
.026
(.028)
.015
(.021)
.050**
(.023)
.083
(.248)
Lafayette Resident
-.005
(.043)
-.008
(.031)
-.053
(.038)
.172
(.468)
High School/Some
College
.196
(.437)
.550**
(.255)
.478*
(.270)
5.910*
(3.088)
College Degree or
Higher
.212
(.594)
.630*
(.373)
.995**
(.469)
5.711
(5.223)
Log Per Capita Income
-.230
(.264)
-.332**
(.148)
-.379*
(.196)
-2.164
(2.129)
Miles from Courthouse
.000
(.000)
.000
(.000)
.000
(.000)
.022
(.024)
45-90 Min. Drive to
Court
-.091
(.059)
.090
(.076)
-.042
(.029)
-
>90 Min. Drive to Court
-.070
(.078)
.041
(.017)
-.002
(.054)
-.892
(.165)
Predicted Probability of
Continuing Next Stage
-.261
(.279)
.106
(.170)
-.142**
(.056)
N/A
N
1495
494
451
32
ln L
-756.65
-117.26
-122.15
-14.23
For Stage 4 estimates, the controls for receiving another less or more severe ticket are excluded because they perfectly predict
success. Probability of success in Stage 4 is forced to equal 1 if these variables equal one.

Quintanar 38
Table 4:
Probit Selection Model Assuming Correlated Errors Between Decision Stages
I
II
III
IV
Selection Model:
Stage 1
Stage 2
Selection Model:
Stage2
Stage 3
African-American
.150**
(.035)
.050
(.031)
.036*
(.019)
.060**
(.028)
Female
-.009
(.027)
-.038
(.031)
-.022
(.018)
-.024
(.023)
Age
-.001
(.005)
.006
(.005)
.004
(.003)
.005
(.005)
Age Squared
-.000
(.000)
-.000
(.000)
-.000
(.000)
-.000
(.000)
5 to 10 Miles Over
-.083
(.074)
.009
(.087)
.001
(.046)
.189
(.151)
11 to 15 Miles Over
-.338**
(.041)
.049
(.061)
.013
(.024)
.017
(.038)
16 to 20 Miles Over
-.067
(.045)
.076
(.053)
.041
(.029)
.005
(.033)
School Zone
-.132
(.166)
.332
(.375)
.061**
(.024)
-.115**
(.032)
Past Violations
-.009
(.020)
-.014
(.027)
-.008
(.017)
-.005
(.011)
Another Less Severe Ticket
.145**
(.060)
-.062
(.072)
-.038
(.044)
.072
(.058)
Another More Severe Ticket
.635**
(.051)
.051
(.040)
.030
(.022)
.139*
(.076)
Judge A
.021
(.026)
.040
(.030)
.022
(.017)
.045*
(.023)
Lafayette Resident
.048
(.067)
.006
(.086)
.031
(.042)
-.053
(.040)
High School/Some College
-.086
(.343)
.994**
(.477)
.532**
(.248)
.334
(.299)
College Degree or Higher
.046
(.557)
.956
(.794)
.521
(.415)
.728
(.478)
Log Per Capita Income
-.116
(.228)
-.553*
(.332)
-.307*
(.170)
-.261
(.198)

Quintanar 39
Table 4, Concluded:
Probit Selection Model Assuming Correlated Errors Between Decision Stages
I
II
III
IV
Selection Model:
Stage 1
Stage 2
Selection Model:
Stage2
Stage 3
Miles from Courthouse
.000
(.000)
.000
(.000)
.000
(.000)
-.000
(.000)
Drive to the Courthouse is
45-90 Minutes
-.040
(.064)
-.158
(.135)
-.113
(.091)
-.046
(.032)
Drive to the Courthouse is
Longer than 90 Minutes
-.071
(.079)
.078**
(.025)
.042**
(.014)
.109
(.130)
Forced Arraignment
.475**
(.164)
Driver is from a Small City
(less than 10,000)
.079
(.068)
In State License
.023
(.117)
.327
(.300)
.194
(.235)
Received Ticket in Home
Zip Code
.017
(.036)
-.092
(.059)
-.064
(.040)
Eligible for Driving Class
-.112*
(.064)
-.103**
(.025)
-.063**
(.017)
N
1476
485
485
444
ln L
-849.48
-228.98
Rho
.908
(.291)
.719
(.789)
Probit marginal effects are listed, with robust standard errors. Conditional marginal effects are reported
for Columns II and IV. The likelihood ratio test fails to reject the null of independent equations for either
model (P-values of 0.404 and 0.296 respectively).

Quintanar 40
Table 5: Explaining Fines: Individuals Who Attend a Hearing
I
II
III
IV
5 to 10 Miles Over
-56.66**
(5.19)
-53.48**
(5.59)
-54.17**
(5.71)
-54.39**
(5.78)
11 to 15 Miles Over
-48.49**
(4.52)
-45.53**
(4.80)
-45.40**
(4.80)
-45.48**
(4.81)
16 to 20 Miles Over
-31.22**
(4.49)
-28.40**
(4.72)
-28.36**
(4.76)
-28.45**
(4.77)
School Zone
8.76**
(1.90)
8.89**
(1.99)
8.54**
(2.10)
8.48**
(2.13)
Past Violations
-.14
(1.68)
-2.75
(2.41)
-2.51
(2.59)
-2.44
(2.57)
$10 Prior Charge
9.22**
(3.43)
8.65**
(3.35)
8.07**
(3.36)
8.20**
(3.31)
$20 Prior Charge
15.98**
(5.40)
14.02**
(5.92)
13.41**
(6.15)
13.45**
(6.12)
$30 Prior Charge
28.78**
(4.84)
25.59**
(4.52)
24.96**
(4.86)
24.86**
(4.71)
Another Less Severe
Ticket
1.66
(3.17)
2.16
(3.22)
2.17
(3.24)
Another More Severe
Ticket
.81
(3.08)
.71
(3.06)
.79
(3.07)
Eligible for Driving Class
-11.66**
(5.16)
-11.36**
(5.14)
-11.05**
(5.05)
High School/Some College
1.44
(21.43)
-2.77
(21.36)
-2.97
(21.29)
College Degree or Higher
25.41
(28.49)
23.55
(28.29)
24.20
(28.59)
Log Per Capita Income
-13.82
(13.08)
-15.30
(12.80)
-15.76
(13.09)
Miles from Courthouse
-.00
(.01)
-.01
(.01)
-.01
(.01)
Received a Reduced
Charge
-2.39
(4.27)
-3.28
(4.15)
-3.31
(4.16)
African-American
-3.18**
(1.42)
-3.20**
(1.43)
Female
.26
(1.56)
.27
(1.56)
Age
-.65**
(.29)
-.64**
(.29)
Age Squared
.01*
(.00)
.01*
(.00)
Judge A
-1.29
(1.54)
N
509
503
494
494
R²
.495
.509
.516
.517
Coefficients estimated by OLS are reported, along with robust standard errors in (parentheses).

Quintanar 41
References
Antonovics, Kate L. and Brian G. Knight. (2009). “A new look at racial profiling: Evidence from
the Boston police department,” The Review of Economics and Statistics 91(1), pp.163-77.
Anwar, Shamena, Bayer, Patrick, and Randi Hjalmarsson. (September 2010). “Jury
discrimination in criminal trials,” NBER Working Paper 16366.
Greene, William H. (2008). Econometric Analysis: Sixth Edition.
Kingsnorth, Rodney, John Lopez, Jennifer Wentworth, and Debra Cummings. (1998) “Adult
sexual assault: The role of racial/ethnic composition in prosecution and sentencing,”
Journal of Criminal Justice 26(5), pp.359-371.
Leiber, M. and Mack, K. (2003). The individual and joint effects of race, gender, and family
status on juvenile justice decision making,” Journal of Research in Crime and
Delinquincy 40, pp.34-71.
Makowsky, Michael and Thomas Stratmann. (2009). “Political economy at any speed: What
determines traffic citations,” American Economic Review 99 (1), pp. 509-527.
Mustard, David B. (2001). “Racial, ethnic, and gender disparities in sentencing: Evidence from
the U.S. federal courts,” Journal of Law and Economics XLIV.
Persico, Nicola. (December 2002). “Racial profiling, fairness, and effectiveness of policing,” The
American Economic Review 92(5).
Reinganum, Jennifer F. (September 1988). “Plea bargaining and prosecutorial discretion,” The
American Economic Review 78(4).
Schanzenbach, Max. (January 2005). “Racial and sex disparities in prison sentences: The effect
of district-level judicial demographics,” Journal of Legal Studies 34.
Wooldredge, John and Amy Thistlethwaite. (May 2004). “Bilevel disparities in court
dispositions for intimate assault,” Criminology 42(2), pp.417-456.
